
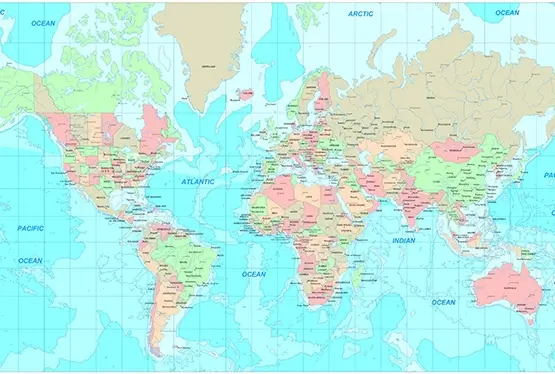
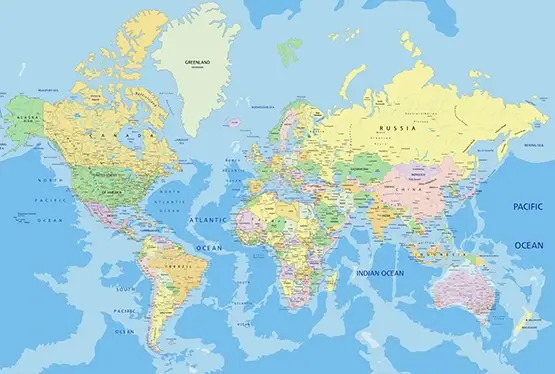
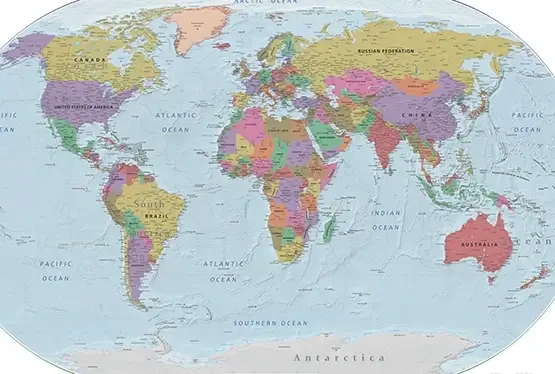
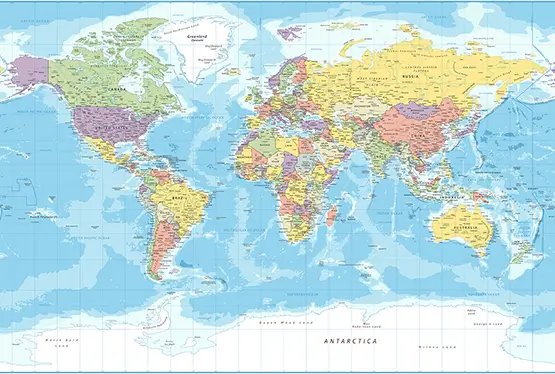
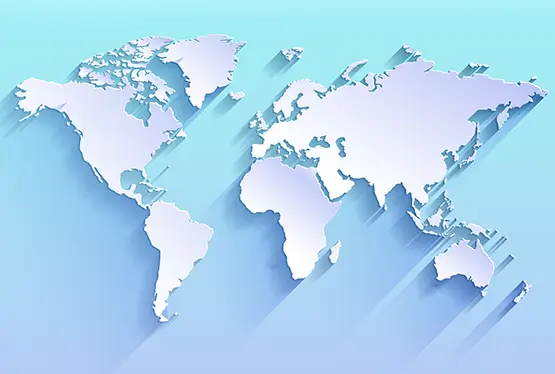
Political Map of the World
High Resolution Political Map of the World

World Maps


GK NXT - Great Knowledge for Genius Kids
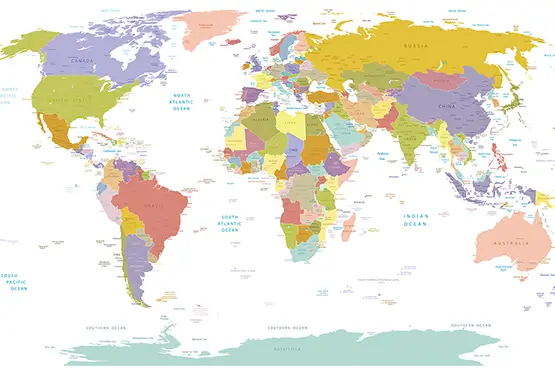
The political map of the world is a colorful tapestry that tells the story of human civilization, diplomacy, and governance. Representing nations, territories, and boundaries, it is both a practical tool and a powerful symbol of global diversity and unity. This article delves into the significance, evolution, and educational value of the political map, bringing to light its intricate details and the history it embodies.
The Purpose of a Political Map
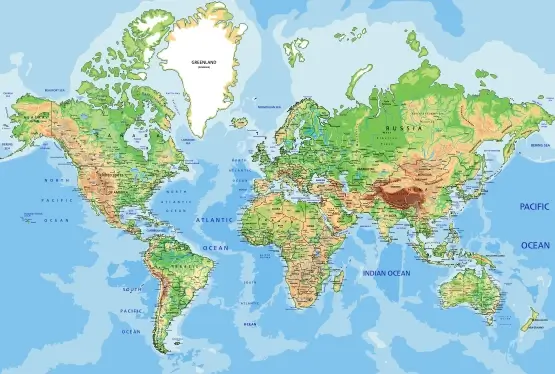
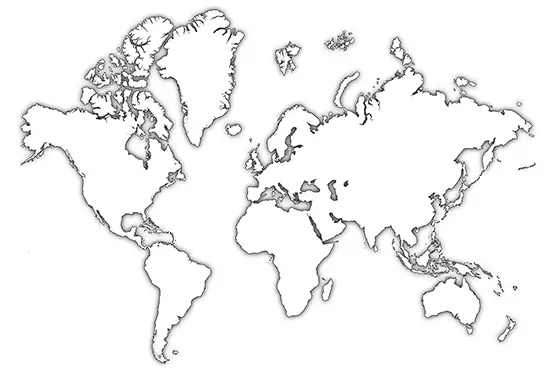
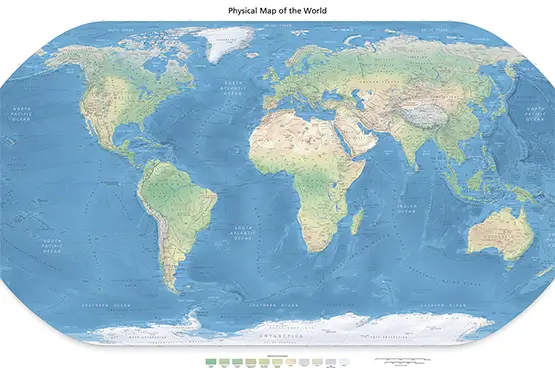
Unlike physical maps that depict natural features like mountains, rivers, and deserts, political maps focus on the human-made divisions of the Earth. These include:
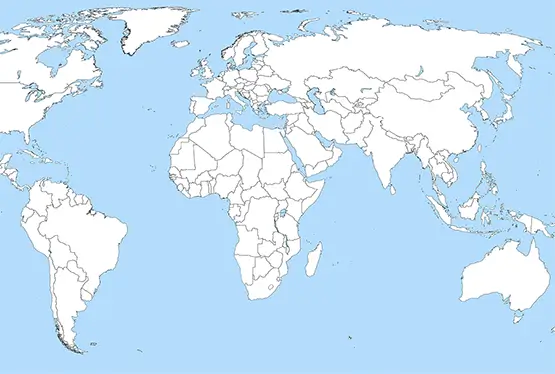
- National boundaries: Lines demarcating sovereign states.
- Capitals and major cities: Highlighting administrative and economic hubs.
- Territorial waters: Maritime zones governed by specific nations.
Political maps are vital for understanding geopolitics, studying international relations, and navigating the legal frameworks of territorial governance. For students, travelers, and policymakers alike, they provide essential context for global interactions.
A Brief History of Political Maps
The earliest political maps date back to ancient civilizations like Mesopotamia and Egypt, where clay tablets and papyrus scrolls depicted territories. The evolution of these maps has been shaped by technological advances and historical events:
- Ancient Cartography: Maps like the Babylonian World Map (~6th century BCE) represented a symbolic view of the world centered on Babylon.
- Medieval Period: Mappa Mundi, such as the Hereford Map (~1300 CE), combined religious cosmology with territorial knowledge.
- Age of Exploration: The 15th-17th centuries saw the rise of more accurate maps as explorers charted new territories, like the Mercator projection (1569).
- Modern Era: Satellite imagery and GIS technology have revolutionized mapmaking, offering precise and dynamic political maps.
Key Features of a Political Map
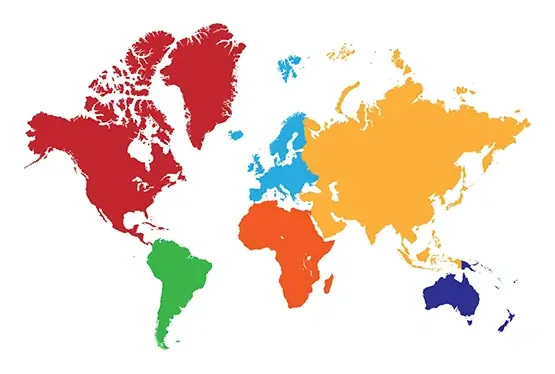
Political maps are characterized by their vibrant colors and detailed annotations. Key elements include:
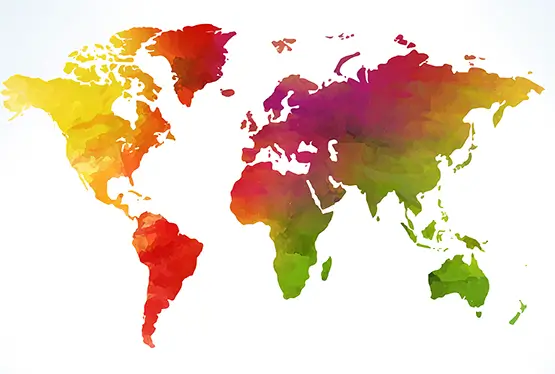
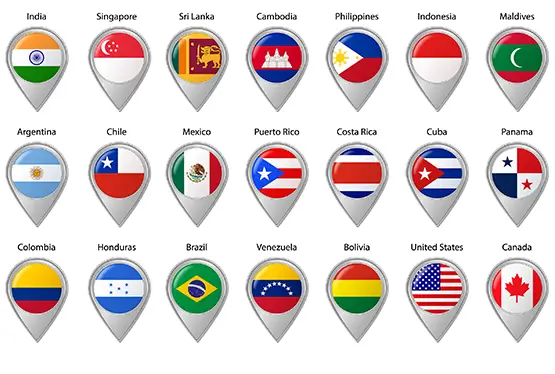
- Color coding: Different colors signify nations or regions, enhancing visual distinction.
- Labels: Names of countries, capitals, and major cities.
- Symbols: Icons representing capitals, airports, and other points of interest.
- Lines and boundaries: Solid or dashed lines indicate national and administrative borders.
Geopolitical Insights from Political Maps
The arrangement of nations on a political map offers insights into historical, cultural, and political phenomena:
- Colonial legacies: Borders in Africa and Asia often reflect arbitrary divisions from colonial rule.
- Conflict zones: Regions like the Kashmir Valley or the Korean Peninsula highlight ongoing disputes.
- Economic clusters: Groupings like the European Union illustrate cooperative zones that transcend borders.
Educational Applications
For educators and learners, political maps are invaluable tools. They:
- Support geography lessons by helping students visualize the location and size of countries.
- Enable discussions on global issues such as climate change, migration, and trade.
- Provide context for historical events like wars, treaties, and alliances.
Challenges and Controversies
Political maps are not without their controversies. Disputes arise over:
- Unrecognized states: Entities like Taiwan and Palestine face varying recognition internationally.
- Border conflicts: Maps often differ in representing disputed territories like Crimea or the South China Sea.
- Projection biases: Maps like the Mercator projection distort the relative size of regions, influencing perceptions.
Interactive and Digital Maps
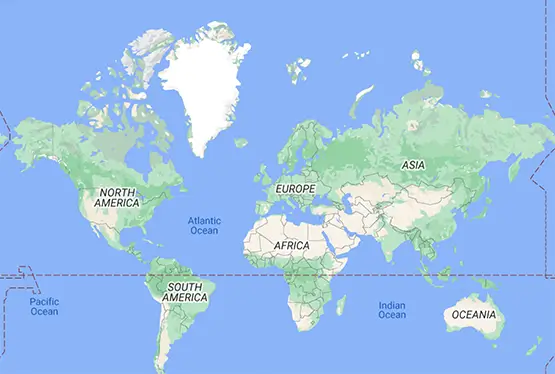
The digital age has brought interactive political maps to the forefront. Tools like Google Maps and GIS platforms allow users to:
- Zoom into regions for detailed exploration.
- Overlay data on demographics, climate, or infrastructure.
- Simulate scenarios like electoral outcomes or economic impacts.
Conclusion
The political map of the world is more than just a representation of boundaries; it is a gateway to understanding the complexities of our global community. From its colorful visuals to its profound implications, it continues to educate and inspire. Whether viewed in classrooms, boardrooms, or on digital screens, political maps remain a cornerstone of geographic literacy and global awareness.
FAQ
Q: What is a political map?
A: A political map depicts human-made divisions like countries, states, and capitals, focusing on governance and territorial boundaries.
Q: How is a political map different from a physical map?
A: While a political map focuses on boundaries and cities, a physical map highlights natural features like mountains and rivers.
Q: What are some examples of interactive political maps?
A: Tools like Google Maps and GIS platforms offer interactive features for exploring boundaries, demographics, and infrastructure.
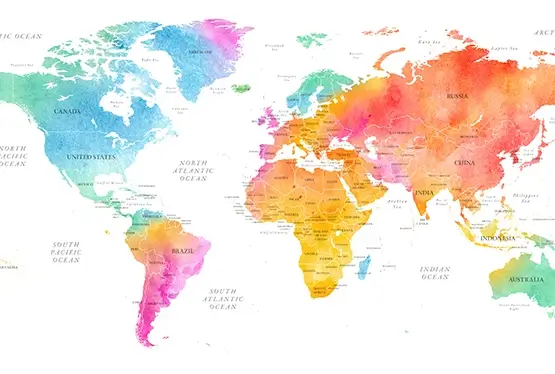
Q: Why are colors important on political maps?
A: Colors help differentiate between countries and regions, making the map easier to read and interpret.
Q: How can political maps be used in education?
A: They aid in geography lessons, discussions on global issues, and understanding historical events and treaties.
Ultra High Resolution Political Map of the World